<div class=”desktop-nav-chips”><!– –><!– –> <div class=”chip”><!– –> <i class=”fa fa-envelope”></i><!– –>info@taspartnership.co.uk<!– –></div> <!– –><!– –> <div class=”chip”><!– –> <i class=”fa fa-phone”></i><!– –>01772 204 988<!– –></div> <!– –><!– –><!– –><!– –><!– –><!– –> <div class=”social-chip”><!– –><div class=”fa-x”><!– –> <a target=”_blank” href=”https://www.linkedin.com/company/the-tas-partnership-limited”> <i class=”fab fa-linkedin-in” data-fa-transform=”shrink-6 ” data-fa-mask=”fas fa-circle” style=”background:”></i></a><!– –></div><!– –></div> <!– –><!– –> <div class=”social-chip”><!– –><div class=”fa-x”><!– –> <a target=”_blank” href=”https://twitter.com/taspartnership?lang=en”> <i class=”fab fa-twitter” data-fa-transform=”shrink-6 ” data-fa-mask=”fas fa-circle” style=”background:”></i></a><!– –></div><!– –></div> <!– –><!– –> <div class=”social-chip”><!– –><div class=”fa-x”><!– –> <a target=”_blank” href=”https://taspartnership.co.uk/feed”> <i class=”fa fa-rss” data-fa-transform=”shrink-6 ” data-fa-mask=”fas fa-circle” style=”background:”></i></a><!– –></div><!– –></div> <!– –> <!– –><!– –></div> <!– –><!– –><style><!– –><!– –><!– –>.desktop-nav-chips{<!– –>position:relative;<!– –>height:100%;<!– –>margin-top: px;<!– –>}<!– –><!– –>.chip {<!– –>position:relative !important;<!– –>top: 9px !important;<!– –> display: inline-block;<!– –> padding: 0 15px;<!– –> font-size: 16px;<!– –> line-height: 30px;<!– –> border-radius: 25px;<!– –> background-color: #ccc;<!– –>color:#2c286c;<!– –><!– –><!– –>}<!– –><!– –>.social-chip {<!– –>position:relative !important;<!– –>top:15px !important;<!– –> display: inline-block;<!– –>font-size:29px;<!– –> line-height: 30px;<!– –>}<!– –><!– –>.social-chip a {<!– –>color:#666699;<!– –>transition:0.3s;<!– –>}<!– –><!– –>.social-chip a:hover {<!– –> color: #2c286c;<!– –><!– –>}<!– –><!– –></style><!– –><div class=”megamenu_wrapper megamenu_container”><!– –> <!– Begin Mega Menu Container –><!– –><!– –><!– –><!– –> <ul class=”megamenu”><!– –> <!– Begin Mega Menu –><!– –><!– –><!– –><!– –> <li><span class=”nodrop”><a href=”https://taspartnership.co.uk/”><i class=”fas fa-home”></i></a></span> </li><!– –><!– –> <li><span class=”drop”>About TAS</span><!– –> <div class=”megamenu_fullwidth narrow-menu-dropdown”><!– –> <div class=””><!– –> <div class=”narrow-menu-dropdown-links”><!– –> <a href=”https://taspartnership.co.uk/about-tas/”>About TAS</a><!– –> <a href=”https://taspartnership.co.uk/our-clients/”>Our Clients</a><!– –> <a href=”https://taspartnership.co.uk/our-partners/”>Our Partners</a><!– –> <a href=”https://taspartnership.co.uk/about-tas/our-team/”>Our Team</a><!– –> </div><!– –> </div><!– –> </div><!– –> </li><!– –><!– –><!– –> <li><!– –> <span class=”drop”>Our Services</span><!– –> <div style=”background:#eee; -webkit-box-shadow: 0px 2px 5px 0px rgba(0,0,0,0.5);<!– –>-moz-box-shadow: 0px 2px 5px 0px rgba(0,0,0,0.5);<!– –>box-shadow: 0px 2px 5px 0px rgba(0,0,0,0.5);” class=”megamenu_fullwidth”><!– –><!– –> <div class=”our-services-dropdown-menu”><!– –> <!– –> <div class=”section group browse-services”><!– –><!– –> <!– –><!– –><!– –> </div><!– –> <!– –> <!– –> <div class=”section group”><!– –><!– –> <div class=”our-services-dropdown-menu-service-grid”><!– –><!– –><!– –> <div class=”col span_1_of_4 “><!– –><!– –> <a class=”market-research” style=”” href=”https://taspartnership.co.uk/our-services/market-research-passenger-surveys/”><!– –> <!– –> <!– –> <span class=”fa-layers fa-fw” ><!– –> <i class=”far fa-circle” style=”color:#393D8E”></i><!– –> <i class=”fas fa-chart-pie ” data-fa-transform=”shrink-8″ style=”color:#393D8E”></i><!– –> </span> <span style=”font-weight: 600; font-size: 0.5em;”>Market Research & Passenger Surveys </span><!– –> <!– –> </a><!– –><!– –> </div><!– –><!– –><!– –> <div class=”col span_1_of_4″><!– –> <a class=”network-reviews” href=”https://taspartnership.co.uk/our-services/network-reviews-scheduling/”><span class=”fa-layers fa-fw” ><!– –> <i class=”far fa-circle” style=”color:#5581B3″></i><!– –> <i class=”fas fa-road ” data-fa-transform=”shrink-8″ style=”color:#5581B3″></i><!– –> </span> <span style=”font-weight: 600; font-size: 0.5em;”> Network Reviews & Scheduling </span></a><!– –><!– –> </div><!– –><!– –><!– –><!– –><!– –><!– –> <div class=”col span_1_of_4″><!– –> <a class=”public-sector” href=”https://taspartnership.co.uk/our-services/public-sector-saving-efficiencies/”><span class=”fa-layers fa-fw” ><!– –> <i class=”far fa-circle” style=”color:#7181d9″></i><!– –> <i class=”fas fa-pound-sign ” data-fa-transform=”shrink-8″ style=”color:#7181d9″></i><!– –> </span> <span style=”font-weight: 600; font-size: 0.5em;”> Public Sector Savings & Efficiencies</span></a><!– –><!– –> </div><!– –><!– –><!– –> <div class=”col span_1_of_4″><!– –> <a class=”training-development” href=”https://taspartnership.co.uk/our-services/training-development/”><span class=”fa-layers fa-fw” ><!– –> <i class=”far fa-circle” style=”color:#A19DCA”></i><!– –> <i class=”fas fa-graduation-cap ” data-fa-transform=”shrink-8″ style=”color:#A19DCA”></i><!– –> </span> <span style=”font-weight: 600; font-size: 0.5em;”> Training & Development</span></a><!– –><!– –> </div><!– –><!– –><!– –> </div><!– –> </div><!– –><!– –><!– –><!– –> <div class=”section group”><!– –><!– –> <div class=”col span_1_of_4″><!– –> <a class=”fares-ticketing” href=”https://taspartnership.co.uk/our-services/fares-ticketing-analysis/”><span class=”fa-layers fa-fw” ><!– –> <i class=”far fa-circle” style=”color:#8A85BD”></i><!– –> <i class=”fas fa-ticket-alt ” data-fa-transform=”shrink-8″ style=”color:#8A85BD”></i><!– –> </span> <span style=”font-weight: 600; font-size: 0.5em;”> Fares & Ticketing Analysis</span></a><!– –><!– –> </div><!– –><!– –><!– –> <div class=”col span_1_of_4″><!– –> <a class=”community-transport” href=”https://taspartnership.co.uk/our-services/community-transport-third-sector/”><span class=”fa-layers fa-fw” ><!– –> <i class=”far fa-circle” style=”color:#338970″></i><!– –> <i class=”fas fa-users ” data-fa-transform=”shrink-8″ style=”color:#338970″></i><!– –> </span> <span style=”font-weight: 600; font-size: 0.5em;”> Community Transport & Third Sector</span></a><!– –><!– –> </div><!– –><!– –> <div class=”col span_1_of_4″><!– –> <a class=”keeping-services” href=”https://taspartnership.co.uk/our-services/keeping-services-sustainable/”><span class=”fa-layers fa-fw” ><!– –> <i class=”far fa-circle” style=”color:#5aa18b”></i><!– –> <i class=”fas fa-recycle ” data-fa-transform=”shrink-8″ style=”color:#5aa18b”></i><!– –> </span> <span style=”font-weight: 600; font-size: 0.5em;”> Keeping Services Sustainable</span></a><!– –><!– –> </div><!– –><!– –> <div class=”col span_1_of_4″><!– –> <a class=”service-search” href=”https://taspartnership.co.uk/our-services/our-services/”><span class=”fa-layers fa-fw” ><!– –> <i class=”far fa-circle” style=”color:#85b8a9″></i><!– –> <i class=”fas fa-search ” data-fa-transform=”shrink-8″ style=”color:#85b8a9″></i><!– –> </span> <span style=”font-weight: 600; font-size: 0.5em;”> Search By Sector</span></a><!– –><!– –> </div><!– –><!– –> </div><!– –> <!– –><!– –><!– –> </div><!– –><!– –> </div><!– –> </li><!– –><!– –><!– –> <li><span class=”nodrop”><a href=”https://taspartnership.co.uk/our-projects/”>Our Projects</a></span> </li><!– –><!– –> <li><span class=”nodrop”><a href=”https://taspartnership.co.uk/tas-news/”>TAS News</a></span> </li><!– –><!– –> <li><span class=”nodrop”><a href=”https://taspartnership.co.uk/contact-us/”>Contact Us</a></span> </li><!– –><!– –> <!– –><!– –><!– –> <!– –> </ul><!– –> <!– End Mega Menu –><!– –><!– –><!– –><!– –> </div><!– –><br><ul class=”breadcrumbs-desktop”><!– –><li><a href=”https://taspartnership.co.uk/”> <i class=”fa fa-home”></i> </a></li><!– –><li> / </li><!– –><li><a href=”https://taspartnership.co.uk/tas-news/”>TAS News</a></li><!– –><li> / </li><!– –><li>News Article</li><!– –> <!– –> <!– –><!– –></ul><!– –><!– –><!– –><!– –><strong>READING CONTROLS CODE</strong><script src=”https://cdnjs.cloudflare.com/ajax/libs/Chart.js/2.4.0/Chart.min.js”></script>
Commuters getting good value for money from weekly bus tickets, finds TAS
Bus passengers are getting a very good deal from weekly bus tickets, the TAS Partnership has found in its latest National Fares Survey (NFS).
The NFS, which analyses 1,047 bus fares across Great Britain from October 2017, shows that weekly bus tickets provide an average discount of 27% when compared with the cost of 10 single fares.
It’s Arrived! Read The Full Report For Free Now
Bus fares lower than regulated rail fares & RPI increases
The report also finds that regulated rail fares have seen higher rises than the bus sector. Rail fares rose by 32% since 2009, compared to a rise of 24% for weekly bus tickets on average; rail fares also rose by 5% in the last two years, more than double the 2% increase in weekly bus tickets.
Meanwhile, day and weekly bus tickets have risen well below RPI: day tickets rose on average by 23% below RPI and weekly tickets 3% below RPI since 2009. Only single bus fares bucked the trend – rising 6% more than RPI. However, TAS has found that single fares are a dying breed and often purchased by fewer than 10% of passengers in urban areas.
The NFS showed the average cost of a weekly bus ticket is £17.09 – a 2% increase from £16.74 in 2015 but 24% higher than in 2009. £4.92 is the cost of the average day ticket – up 2% from £4.83 in 2015 but up by only 4% since 2009. Finally, the average cost of a single fare was £2.33 – an increase of 5% since the previous 2015 survey but 33% higher than in 2009.
M-ticketing & contactless payment on the rise
A strong trend to emerge from the survey is that mobile ticketing is taking the lead over smartcards, while contactless payment is the popular new kid on the block. M-ticketing was available on 92% of the journeys covered by the survey – a 43% increase from 2015 – compared with 76% coverage by smartcards; meanwhile payment by contactless bankcards has made an impressive impact over a short period of time, and was available for 30% of trips.
- Go-Ahead has the highest contactless coverage with 73% of fares surveyed.
- Also strong is Stagecoach at 58% and the group is in the process of rolling out contactless payment and should have reached 100% by 2019.
- First is also in the process of rolling out contactless payment and their contactless coverage from the survey was 26%.
- Arriva’s contactless quota was 3% when the survey findings were gathered.
Views from the industry
“ It is a good news story for the bus industry that weekly bus fares offer such good value for passengers and a testament to the bus industry”
Matthew Moll
Senior Consultant, The TAS Partnership
Commenting on the findings of the NFS, Matthew Moll, Senior consultant of The TAS Partnership said: “It is a good news story for the bus industry that weekly bus fares offer such good value for passengers and a testament to the bus industry, whose costs are ever rising, that increases in its multi-journey tickets are well below those of RPI and compare favourably to rail.
“At the same time, we have noticed an increasing number of operators not selling weekly tickets or top ups for them on-bus,” continued Matthew. “While the intention might be to reduce dwell times at stops, the effect may well supress demand for weekly tickets on certain parts of operators’ networks.”
Simon Posner, Chief Executive of the Confederation of Passenger Transport said: “This useful analysis by TAS highlights yet again that bus travel remains remarkably good value for money compared to other modes. It also shows that operators are investing heavily in new technology – contactless, mobile ticketing etc. – responding to passenger aspirations and the way we now live our lives.
Simon continued: “It is also important to recognise that operators are making these investments whilst facing the challenges of increasing road congestion, new legislation, and pressure to upgrade vehicles in light of the Government’s air quality requirements, together with ever rising operating costs. In short, this analysis shows that bus operators are continuing to deliver for passengers.”
“ This useful analysis by TAS highlights yet again that bus travel remains remarkably good value for money compared to other modes. . .”
Simon Posner
Chief Executive of the Confederation of Passenger Transport
“ We need to find new ways of helping those who don’t have access to smart technology and possibly only work a day or two a week ”
Claire Walters
Chief executive of Bus Users UK
Claire Walters, chief executive of Bus Users UK commented: “Buses generally provide excellent value for money and it’s good to see prices for weekly tickets are providing good options for passengers. However, we need to find new ways of helping those who don’t have access to smart technology and possibly only work a day or two a week – their travel costs will take up a much larger proportion of their income, limiting the options for people already at a disadvantage. Bus operators have overcome major obstacles with creativity and imagination – I am confident they will find a way to meet this passenger need.”
David Sidebottom, director of Transport Focus, said: “Bus passengers tell us their top priority for improvement is a better value for money bus journey. Bus operators need to make passengers feel confident that they are buying the best fare, alongside running a punctual and reliable service. One way they can do this is by publicising their fares and fare deals – we know that many passengers say they find it hard to get this information in advance.”
“ Bus operators need to make passengers feel confident that they are buying the best fare, alongside running a punctual and reliable service. . . .”
David Sidebottom
Director of Transport Focus
Key Statistics
<!– –><a href=”#chart1″>Average Weekly Ticket</a><!– –><a href=”#chart2″>Average Day Ticket</a><!– –><a href=”#chart3″>Average Single</a><!– –><a href=”#chart4″>Fare Averages by Operator</a><!– –><a href=”#chart5″>Multi-Operator Tickets</a><!– –><a href=”#chart6″>Smartcards, Mobile Tickets and Contactless </a><!– –><a href=”#chart7″>Regional Averages</a><!– –><a href=”#download”>Download Now</a>
Find Detailed Analysis and Much More Inside Our Highly Anticipated Industry Report
<!– LINK –><!– –><!– –><!– –><a name=”chart1″></a> <!– –><!– –><!– TITLE –><!– –><!– –><h3>Average Weekly Ticket Prices: 2009-2017</h3> <!– –><!– –><!– CHART –><!– –><!– –><!– –><div style=”height: 300px”><!– –> <center><!– –><canvas style=”background:#fff;” height=”280″ id=”myChart2″></canvas><!– –> </center><!– –></div><!– –><!– –> <!– TABLE –><!– –><!– –><!– –><div class=”datagrid”><!– –> <table><!– –> <tbody><!– –> <tr class=”table-header”><!– –> <td>Measure</td><!– –> <td>2009</td><!– –> <td>2011</td><!– –> <td>2013</td><!– –> <td>2015</td><!– –> <td>2017</td><!– –> <td>2017 vs 2015</td><!– –> <td>2017 vs 2009</td><!– –> </tr><!– –> <tr><!– –> <td>Average</td><!– –> <td>£13.78</td><!– –> <td>£15.16</td><!– –> <td>£16.64</td><!– –> <td>£16.74</td><!– –> <td>£17.09</td><!– –> <td class=”plus”><i class=”fas fa-arrow-up”></i> 2%</td><!– –> <td class=”plus”><i class=”fas fa-arrow-up”></i> 24%</td><!– –> </tr><!– –> <tr><!– –> <td>Minimum</td><!– –> <td>£5.00</td><!– –> <td>£6.00</td><!– –> <td>£7.50</td><!– –> <td>£5.00</td><!– –> <td>£6.00</td><!– –> <td class=”plus”><i class=”fas fa-arrow-up”></i> 20%</td><!– –> <td class=”plus”><i class=”fas fa-arrow-up”></i> 20%</td><!– –> </tr><!– –> <tr><!– –> <td>Maximum</td><!– –> <td>£30.00</td><!– –> <td>£35.00</td><!– –> <td>£42.00</td><!– –> <td>£39.00</td><!– –> <td>£35.00</td><!– –> <td class=”minus”><i class=”fas fa-arrow-down”></i> -10%</td><!– –> <td class=”plus”><i class=”fas fa-arrow-up”></i> 17%</td><!– –> </tr><!– –> </tbody><!– –> </table><!– –> </div> <!– –> <!– –> <!– –><!– LIST –><!– –><!– –><!– –><div class=”highlight-section”><!– –><ul class=”tas-list-2-col fa-ul”><!– –> <li><span class=”fa-li”><i class=”fa fa-square”></i></span>The mean weekly ticket price was £17.09 – slightly over 7.3 times the average single fare<!– –> </li><!– –><li><span class=”fa-li”><i class=”fa fa-square”></i></span>The minimum weekly ticket price in our sample was £6.00 – Go South Coast’s Bluestar 18 Weekly in Southampton<!– –> </li><!– –><li><span class=”fa-li”><i class=”fa fa-square”></i></span>The maximum weekly ticket price in our sample was £35.00 – Stagecoach East Midlands’ ‘East Midland Megarider Connect’ and TrentBarton’s land saver7 tickets<!– –> </li><!– –><!– –> <!– –></ul><!– –></div><!– –><!– –><!– –><!– JS –><!– –><!– –><!– –><!– –><!– –><script><!– –> let myChart2 = document.getElementById(‘myChart2’).getContext(‘2d’);<!– –><!– –> let DayTicket = new Chart(myChart2, {<!– –> type: ‘line’,<!– –> data: {<!– –> labels: [‘2009’, ‘2011’, ‘2013’, ‘2015’, ‘2017’],<!– –> datasets: [{<!– –> label: ‘Average’,<!– –> fil: false,<!– –> borderColor: “#81BC98”,<!– –> backgroundColor: “rgba(44, 40, 108, 0)”,<!– –> borderWidth: 3,<!– –> data: [13.78,<!– –> 15.16,<!– –> 16.64,<!– –> 16.74,<!– –> 17.09<!– –> ]<!– –> },<!– –><!– –> {<!– –> label: ‘Minimum’,<!– –> backgroundColor: “rgba(44, 40, 108, 0)”,<!– –> borderColor: “#8345cb”,<!– –> borderWidth: 3,<!– –> fil: false,<!– –> data: [5.0,<!– –> 6.0,<!– –> 7.50,<!– –> 5.0,<!– –> 6.0<!– –> ]<!– –> },<!– –> {<!– –> label: ‘Maximum’,<!– –> backgroundColor: “rgba(44, 40, 108, 0)”,<!– –> borderColor: “rgb(138, 133, 189)”,<!– –> borderWidth: 3,<!– –> fil: false,<!– –> data: [30.00,<!– –> 35.00, <!– –>42.00,<!– –> 39.00,<!– –> 35.00<!– –> ]<!– –> },<!– –> ]<!– –><!– –> },<!– –> options: {<!– –> responsive: true,<!– –> maintainAspectRatio: false,<!– –> <!– –> <!– –> title: {<!– –> display: false,<!– –> text: “Average Weekly Ticket Prices: 2009-2017″,<!– –> fontSize: 20,<!– –><!– –><!– –> },<!– –> legend: {<!– –> borderWidth: 1,<!– –> position: ‘bottom’,<!– –> display: true,<!– –> },<!– –><!– –> labels: {<!– –> fontColor: ‘#0045ff’,<!– –> fontWeight: ‘700’,<!– –> },<!– –><!– –> layout: {<!– –> padding: {<!– –> left: 10,<!– –> right: 10,<!– –> top: 5,<!– –> bottom: 5,<!– –> },<!– –> tooltips: {<!– –> fontSize: 20,<!– –> padding: {<!– –> left: 50,<!– –> right: 50,<!– –> top: 50,<!– –> bottom: 50,<!– –> }, <!– –><!– –> }<!– –><!– –> }<!– –><!– –> } // Options End<!– –><!– –><!– –><!– –> });<!– –> </script><!– LINK –><!– –><!– –><!– –><a name=”chart2″></a> <!– –><!– –><!– –><!– TITLE –><!– –><!– –><h3>Average Day Ticket Prices: 2009-2017</h3> <!– –><a name=”chart2″></a> <!– –><!– CHART –><!– –><!– –><!– –><div style=”height: 300px”><!– –> <center><!– –><canvas style=”background:#fff;” height=”280″ id=”myChart3″></canvas><!– –> </center><!– –></div><!– –><!– –> <!– TABLE –><!– –><!– –><!– –><div class=”datagrid”><!– –><!– –> <table><!– –> <tr class=”table-header”><!– –> <td>Measure</td><!– –> <td>2009</td><!– –> <td>2011</td><!– –> <td>2013</td><!– –> <td>2015</td><!– –> <td>2017</td><!– –> <td>2017 vs 2015</td><!– –> <td>2017 vs 2009</td><!– –> </tr><!– –> <tr><!– –> <td>Average</td><!– –> <td>£4.72</td><!– –> <td>£4.52</td><!– –> <td>£4.74</td><!– –> <td>£4.83</td><!– –> <td>£4.92</td><!– –> <td>+2%</td><!– –> <td>+4%</td><!– –> </tr><!– –> <tr><!– –> <td>Minimum</td><!– –> <td>£1.70</td><!– –> <td>£2.00</td><!– –> <td>£2.40</td><!– –> <td>£2.00</td><!– –> <td>£2.40</td><!– –> <td>+20%</td><!– –> <td>+41%</td><!– –> </tr><!– –> <tr><!– –> <td>Maximum</td><!– –> <td>£14.00</td><!– –> <td>£15.00</td><!– –> <td>£15.00</td><!– –> <td>£15.30</td><!– –> <td>£16.00</td><!– –> <td>+5%</td><!– –> <td>+14%</td><!– –> </tr><!– –> <!– –> </table><!– –><!– –><!– –><!– –><!– –> </div> <!– –> <!– –> <!– –><!– LIST –><!– –><!– –><!– –><div class=”highlight-section”><!– –><ul class=”tas-list-2-col fa-ul”><!– –> <li><span class=”fa-li”><i class=”fa fa-square”></i></span>The average day ticket price was £4.92 – 6% more than twice the average single of £2.33<!– –> </li><!– –><li><span class=”fa-li”><i class=”fa fa-square”></i></span>The minimum day ticket price in the sample was £2.40 – Diamond Bus’ Redditch Day ticket and EYMS Beverley Day Rover ticket<!– –> </li><!– –><li><span class=”fa-li”><i class=”fa fa-square”></i></span>The maximum day ticket price in the sample was £16.00 –Transdev Blazefield’s Daytripper Plus ticket (on Yorkshire Coastliner)<!– –> </li><!– –><!– –> <!– –></ul><!– –></div><!– –><!– –><!– –><!– JS –><!– –><!– –><!– –><!– –><!– –><script><!– –><!– –> var ctx2 = document.getElementById(‘myChart3’).getContext(‘2d’);<!– –><!– –> var massPopChart = new Chart(myChart3, {<!– –> type: ‘line’,<!– –> data: {<!– –> labels: [‘2009’, ‘2011’, ‘2013’, ‘2015’, ‘2017’],<!– –> datasets: [{<!– –> label: ‘Average’,<!– –> fil: false,<!– –> borderColor: “#81BC98”,<!– –> backgroundColor: “rgba(44, 40, 108, 0)”,<!– –> borderWidth: 3,<!– –> data: [4.72,<!– –> 4.52,<!– –> 4.74,<!– –> 4.83,<!– –> 4.92<!– –> ]<!– –> },<!– –><!– –> {<!– –> label: ‘Minimum’,<!– –> backgroundColor: “rgba(44, 40, 108, 0)”,<!– –> borderColor: “#8345cb”,<!– –> borderWidth: 3,<!– –> fil: false,<!– –> data: [1.70,<!– –> 2.0,<!– –> 2.4,<!– –> 2.0,<!– –> 2.40<!– –> ]<!– –> },<!– –> {<!– –> label: ‘Maximum’,<!– –> backgroundColor: “rgba(44, 40, 108, 0)”,<!– –> borderColor: “rgb(138, 133, 189)”,<!– –> borderWidth: 3,<!– –> fil: false,<!– –> data: [14.00,<!– –> 15.00,<!– –> 15.00,<!– –> 15.30,<!– –> 16.00<!– –> ]<!– –> },<!– –> ]<!– –><!– –> },<!– –> options: {<!– –> responsive: true,<!– –> maintainAspectRatio: false,<!– –> <!– –> <!– –> title: {<!– –> display: false,<!– –> text: “Average Weekly Ticket Prices: 2009-2017″,<!– –> fontSize: 20,<!– –><!– –><!– –> },<!– –> legend: {<!– –> borderWidth: 1,<!– –> position: ‘bottom’,<!– –> display: true,<!– –> },<!– –><!– –> labels: {<!– –> fontColor: ‘#0045ff’,<!– –> fontWeight: ‘700’,<!– –> },<!– –><!– –> layout: {<!– –> padding: {<!– –> left: 10,<!– –> right: 10,<!– –> top: 5,<!– –> bottom: 5,<!– –> },<!– –> tooltips: {<!– –> fontSize: 20,<!– –> padding: {<!– –> left: 50,<!– –> right: 50,<!– –> top: 50,<!– –> bottom: 50,<!– –> }, <!– –><!– –> }<!– –><!– –> }<!– –><!– –> } // Options End<!– –><!– –> }); // Chart 2 End */<!– –> <!– –> </script><!– LINK –><!– –><!– –><!– –><a name=”chart3″></a> <!– –><!– –><!– –><!– TITLE –><!– –><!– –><h3>Average Single Fares: 2009-2017</h3> <!– –><a name=”chart2″></a> <!– –><!– CHART –><!– –><!– –><!– –><div style=”height: 300px”><!– –> <center><!– –><canvas style=”background:#fff;” height=”280″ id=”myChart4″></canvas><!– –> </center><!– –></div><!– –><!– –> <!– TABLE –><!– –><!– –><!– –><div class=”datagrid”><!– –> <table><!– –> <tr class=”table-header”><!– –> <td>Measure</td><!– –> <td>2009 Fare</td><!– –> <td>2011 Fare</td><!– –> <td>2013 Fare</td><!– –> <td>2015 Fare</td><!– –> <td>2017 Fare</td><!– –> <td>2017 vs 2015</td><!– –> <td>2017 vs 2009</td><!– –> </tr><!– –> <tr><!– –> <td>Average</td><!– –> <td>£1.75</td><!– –> <td>£1.91</td><!– –> <td>£2.11</td><!– –> <td>£2.21</td><!– –> <td>£2.33</td><!– –> <td>+5%</td><!– –> <td>+33%</td><!– –> </tr><!– –> <tr><!– –> <td>Minimum</td><!– –> <td>£0.50</td><!– –> <td>£0.70</td><!– –> <td>£0.80</td><!– –> <td>£1.10</td><!– –> <td>£1.20</td><!– –> <td>+9%</td><!– –> <td>+140%</td><!– –> </tr><!– –> <tr><!– –> <td>Maximum</td><!– –> <td>£3.50</td><!– –> <td>£3.85</td><!– –> <td>£5.00</td><!– –> <td>£4.00</td><!– –> <td>£4.20</td><!– –> <td>+5%</td><!– –> <td>+20%</td><!– –> </tr><!– –> <tr><!– –> <td>Sample (n)</td><!– –> <td>804</td><!– –> <td>1,073</td><!– –> <td>1,155</td><!– –> <td>1,028</td><!– –> <td>1,047</td><!– –> <td></td><!– –> <td></td><!– –> </tr><!– –> <!– –> </table><!– –><!– –> </div> <!– –> <!– –> <!– –><!– LIST –><!– –><!– –><!– –><div class=”highlight-section”><!– –><ul class=”tas-list-2-col fa-ul”><!– –> <li><span class=”fa-li”><i class=”fa fa-square”></i></span>The average (mean) single fare was £2.33<!– –> </li><!– –><li><span class=”fa-li”><i class=”fa fa-square”></i></span>The minimum single fare in the sample was £1.20 – Stagecoach East Midlands in Hull<!– –> </li><!– –><li><span class=”fa-li”><i class=”fa fa-square”></i></span>The maximum single fare in the sample was £4.20 – on First South West from Falmouth<!– –> </li><!– –><!– –> <!– –></ul><!– –></div><!– –><!– –><!– –><!– JS –><!– –><!– –><!– –><!– –><!– –><script><!– –> var ctx3 = document.getElementById(‘myChart4’).getContext(‘2d’);<!– –><!– –> var massPopChart = new Chart(myChart4, {<!– –> type: ‘line’,<!– –> data: {<!– –> labels: [‘2009’, ‘2011’, ‘2013’, ‘2015’, ‘2017’],<!– –> datasets: [{<!– –> label: ‘Average’,<!– –> fil: false,<!– –> borderColor: “#81BC98”,<!– –> backgroundColor: “rgba(44, 40, 108, 0)”,<!– –> borderWidth: 3,<!– –> data: [1.75,<!– –> 1.71,<!– –> 2.11,<!– –> 2.21,<!– –> 2.33<!– –> ]<!– –> },<!– –><!– –> {<!– –> label: ‘Minimum’,<!– –> backgroundColor: “rgba(44, 40, 108, 0)”,<!– –> borderColor: “#8345cb”,<!– –> borderWidth: 3,<!– –> fil: false,<!– –> data: [0.50,<!– –> 0.70,<!– –> 0.80,<!– –> 1.1,<!– –> 1.2<!– –> ]<!– –> },<!– –> {<!– –> label: ‘Maximum’,<!– –> backgroundColor: “rgba(44, 40, 108, 0)”,<!– –> borderColor: “rgb(138, 133, 189)”,<!– –> borderWidth: 3,<!– –> fil: false,<!– –> data: [3.5,<!– –> 3.85,<!– –> 5.00,<!– –> 4.00,<!– –> 4.20<!– –> ]<!– –> },<!– –> ]<!– –><!– –> },<!– –> options: {<!– –> responsive: true,<!– –> maintainAspectRatio: false,<!– –><!– –><!– –> title: {<!– –> display: false,<!– –> text: “Average Weekly Ticket Prices: 2009-2017″,<!– –> fontSize: 20,<!– –><!– –><!– –> },<!– –> legend: {<!– –> borderWidth: 1,<!– –> position: ‘bottom’,<!– –> display: true,<!– –> },<!– –><!– –> labels: {<!– –> fontColor: ‘#0045ff’,<!– –> fontWeight: ‘700’,<!– –> },<!– –><!– –> layout: {<!– –> padding: {<!– –> left: 10,<!– –> right: 10,<!– –> top: 5,<!– –> bottom: 5,<!– –> },<!– –> tooltips: {<!– –> fontSize: 20,<!– –> padding: {<!– –> left: 50,<!– –> right: 50,<!– –> top: 50,<!– –> bottom: 50,<!– –> },<!– –><!– –> }<!– –><!– –> }<!– –><!– –> } // Options End<!– –><!– –> }); // Chart 3 End */<!– –> </script><!– LINK –><!– –><!– –><!– –><a name=”chart4″></a> <!– –><!– –><!– –><!– TITLE –><!– –><!– –><h3>Fare Averages by Operator </h3> <!– –><a name=”chart2″></a> <!– –><!– CHART –><!– –><!– –><!– –> <div style=”height: 500px”><!– –> <center><!– –> <canvas style=”background:#fff;” height=”480″ id=”myChart5″></canvas><!– –> </center><!– –> </div><!– –><!– –> <!– TABLE –><!– –><!– –><!– –><div class=”datagrid”><!– –> <table><!– –> <tr class=”table-header”><!– –> <td>Operator </td><!– –> <td>Average Weekly Ticket </td><!– –> <td>Average Day Ticket </td><!– –> <td>Average Single Fare</td><!– –> </tr><!– –> <tr><!– –> <td>Arriva</td><!– –> <td>£17.10</td><!– –> <td>£4.92</td><!– –> <td>£2.33</td><!– –> </tr><!– –> <tr><!– –> <td>First</td><!– –> <td>£17.24</td><!– –> <td>£4.72</td><!– –> <td>£2.43</td><!– –> </tr><!– –> <tr><!– –> <td>Go-Ahead</td><!– –> <td>£17.73</td><!– –> <td>£5.01</td><!– –> <td>(Highest) £2.48</td><!– –> </tr><!– –> <tr><!– –> <td>Independent</td><!– –> <td> (Highest) £19.62</td><!– –> <td> (Highest) £5.56</td><!– –> <td>£2.31</td><!– –> </tr><!– –> <tr><!– –> <td>Municipal</td><!– –> <td>£18.20</td><!– –> <td>£5.30</td><!– –> <td>£2.27</td><!– –> </tr><!– –> <tr><!– –> <td>National Express</td><!– –> <td>£14.86</td><!– –> <td>£4.23</td><!– –> <td> (Lowest) £1.96</td><!– –> </tr><!– –> <tr><!– –> <td>Stagecoach</td><!– –> <td> (Lowest) £11.00</td><!– –> <td> (Lowest) £3.89</td><!– –> <td>£2.35</td><!– –> </tr><!– –> <tr><!– –> <td>Transdev</td><!– –> <td>£16.07</td><!– –> <td>£4.92</td><!– –> <td>£2.27</td><!– –> </tr><!– –> <tr><!– –> <td>Overall Averages</td><!– –> <td>£17.09</td><!– –> <td>£4.92</td><!– –> <td>£2.33</td><!– –> </tr><!– –> <!– –> </table><!– –><!– –><!– –> </div><!– –> <!– –> <!– –><!– –><!– JS –><!– –><!– –><!– –><!– –><!– –><script><!– –> var ctx4 = document.getElementById(‘myChart5’).getContext(‘2d’);<!– –><!– –> var massPopChart = new Chart(myChart5, {<!– –> type: ‘horizontalBar’,<!– –> data: {<!– –> labels: [‘Arriva’, ‘First’, ‘Go-Ahead’, ‘Independent’, ‘Municipal’, ‘NatEx’, ‘Stagecoach’, ‘Transdev’],<!– –> datasets: [{<!– –> label: ‘Average Weekly Ticket’,<!– –> fil: false,<!– –> borderColor: “#7E9ED1”,<!– –> backgroundColor: “rgba(126, 158, 209, 0.85)”,<!– –> <!– –> borderWidth: 3,<!– –> data: [<!– –> 17.10,<!– –> 17.24,<!– –> 17.73,<!– –> 19.62,<!– –> 18.20,<!– –> 14.86,<!– –> 11.00,<!– –> 16.07,<!– –> <!– –> <!– –> ]<!– –> },<!– –><!– –> {<!– –> label: ‘Average Day Ticket’,<!– –> backgroundColor: “rgba(44, 40, 108, 0)”,<!– –> borderColor: “#4363AE”,<!– –> backgroundColor: “rgba(67, 99, 174, 0.85)”,<!– –> borderWidth: 3,<!– –> fil: false,<!– –> data: [<!– –> 4.92,<!– –> 4.72,<!– –> 5.01,<!– –> 5.56,<!– –> 5.30,<!– –> 4.23,<!– –> 3.89,<!– –> 4.92<!– –> <!– –> <!– –> ]<!– –> },<!– –> {<!– –> label: ‘Average Single Fare’,<!– –> backgroundColor: “rgba(44, 40, 108, 0)”,<!– –> borderColor: “#393D8E”,<!– –> backgroundColor: “rgba(57, 61, 142, 0.85)”,<!– –> borderWidth: 3,<!– –> fil: false,<!– –> data: [2.33,<!– –> 2.43,<!– –> 2.48,<!– –> 2.31,<!– –> 2.27,<!– –> 1.96,<!– –> 2.35,<!– –> 2.27<!– –> ]<!– –> },<!– –> ]<!– –><!– –> },<!– –> options: {<!– –> responsive: true,<!– –> maintainAspectRatio: false,<!– –><!– –><!– –> title: {<!– –> display: false,<!– –> text: “Average Weekly Ticket Prices: 2009-2017″,<!– –> fontSize: 20,<!– –><!– –><!– –> },<!– –> legend: {<!– –> borderWidth: 1,<!– –> position: ‘bottom’,<!– –> display: true,<!– –> },<!– –><!– –> labels: {<!– –> fontColor: ‘#0045ff’,<!– –> fontWeight: ‘700’,<!– –> },<!– –><!– –> layout: {<!– –> padding: {<!– –> left: 10,<!– –> right: 10,<!– –> top: 5,<!– –> bottom: 5,<!– –> },<!– –> tooltips: {<!– –> fontSize: 20,<!– –> padding: {<!– –> left: 50,<!– –> right: 50,<!– –> top: 50,<!– –> bottom: 50,<!– –> },<!– –><!– –> }<!– –><!– –> }<!– –><!– –> } // Options End<!– –><!– –> }); // Chart 5 End */<!– –> </script><!– –><!– –><!– LINK –><!– –><!– –><!– –><a name=”chart5″></a> <!– –><!– –><!– –><!– TITLE –><!– –><!– –><h3>Multi-Operator Tickets </h3> <!– –><a name=”chart2″></a> <!– –><!– CHART –><!– –><!– –><!– –> <!– –><!– –> <!– –> <!– –> <!– –><!– LIST –><!– –><!– –><!– –><div class=”highlight-section”><!– –> <!– –> <P> 74% of the sample trips had a multi-operator alternative, but this does vary by market, operating group and region:<!– –> </P><!– –><ul class=”tas-list-2-col fa-ul”><!– –> <li><span class=”fa-li”><i class=”fa fa-square”></i></span>there is 100% availability of multi-operator tickets in PTE areas<!– –> </li><!– –><li><span class=”fa-li”><i class=”fa fa-square”></i></span>88% in Wales<!– –> </li><!– –><li><span class=”fa-li”><i class=”fa fa-square”></i></span>58% in East Midlands<!– –> </li><!– –><li><span class=”fa-li”><i class=”fa fa-square”></i></span>45% in the interurban market (which tends to be served by single operators).<!– –> </li><!– –> <!– –></ul><!– –></div><!– –><!– –><!– –><!– JS –><!– –><!– –><!– –><!– –><!– –><a name=”chart6″></a> <!– –><!– LINK –><!– –><!– –><!– –><!– TITLE –><!– –><!– –><h3>Smartcards, Mobile Tickets and Contactless </h3> <!– –><!– –><!– CHART –><!– –><!– –><!– –> <!– –><!– –> <!– –> <!– –> <!– –><!– LIST –><!– –><!– –><!– –><div class=”highlight-section”><!– –><!– –><!– –><ul class=”tas-list-2-col fa-ul”><!– –> <li><span class=”fa-li”><i class=”fa fa-square”></i></span>76% of journeys had a smartcard as a ticketing option<!– –> (this varied from 94% in Yorkshire & Humber region to 43% in the East of England)<!– –><!– –> </li><!– –><li><span class=”fa-li”><i class=”fa fa-square”></i></span>92% had an M-Ticket as a ticketing option<!– –>)this varied from 100% in the North East region to 75% in the East Midlands_<!– –><!– –> </li><!– –><li><span class=”fa-li”><i class=”fa fa-square”></i></span>30% of trips could have been paid for by contactless payment<!– –>(this varied from 0% in Wales and the West Midlands to 70% in the North East )<!– –><!– –> <!– –> <!– –></ul><!– –></div><!– –><!– –><!– –><!– JS –><!– –><!– –><!– –><!– –><!– –><a name=”chart7″></a> <!– –><!– LINK –><!– –><!– –><!– –><!– TITLE –><!– –><!– –><h3>Regional Averages </h3>[NFSUK1][NFSUK3][NFSUK2]<a name=”download”></a><!– –><h3><!– –> Share<!– –></h3><!– –><!– –>[indeed-social-media sm_list=’fb,tw,goo,li,pf,email,whatsapp,gmail,love_like,mailto’ sm_template=’ism_template_6′ sm_list_align=’horizontal’ sm_display_counts=’false’ sm_display_full_name=’true’ box_align=’center’ no_cols=’5′]
More News
<p><div class=”et_pb_posts et_pb_module et_pb_bg_layout_light et_pb_blog_extras_1″><br /> <div class=”el-dbe-blog-extra block_extended”><article id=”post-3887″ class=”et_pb_post et_pb_post_extra et_pb_text_align_left et-waypoint et_pb_animation_top el_dbe_block_extended image-top post-3887 type-post status-publish format-standard has-post-thumbnail hentry category-bus category-national-news”><br /> <div class=”post-categories”><a href=”https://taspartnership.co.uk/category/bus/” rel=”category tag”>Bus</a><a href=”https://taspartnership.co.uk/category/national-news/” rel=”category tag”>National News</a></div><br /> <div class=”post-media-container”><br /> <div class=”post-media” style=”background-image: url(‘https://taspartnership.co.uk/wp-content/uploads/2018/03/tas-news-Thumbnail.jpg’);”><a class=”entry-featured-image-url” href=”https://taspartnership.co.uk/national-fares-survey-2018/”><br /> <img src=”https://taspartnership.co.uk/wp-content/uploads/2018/03/tas-news-Thumbnail.jpg” alt=”National Fares Survey 2018″ /><br /> </a></div><br /> </div><br /> <div class=”post-content”></p><p><a class=”abs-url” href=”https://taspartnership.co.uk/national-fares-survey-2018/”>National Fares Survey 2018</a><br /> <h2 class=”entry-title”><a href=”https://taspartnership.co.uk/national-fares-survey-2018/”>National Fares Survey 2018</a></h2><br /> <div class=”post-data”>The latest National Fares Survey – a two-yearly analysis of over 1,000 bus fares across Great Britain.</div><br /> </div><br /> <p class=”post-meta”><span class=”published”><span class=”et-pb-icon”></span>Mar 25, 2018</span></p></p><p></article><!– .et_pb_post_extra –></p><p><article id=”post-3881″ class=”et_pb_post et_pb_post_extra et_pb_text_align_left et-waypoint et_pb_animation_top el_dbe_block_extended image-top post-3881 type-post status-publish format-standard has-post-thumbnail hentry category-community-transport”><br /> <div class=”post-categories”><a href=”https://taspartnership.co.uk/category/community-transport/” rel=”category tag”>Community Transport</a></div><br /> <div class=”post-media-container”><br /> <div class=”post-media” style=”background-image: url(‘https://taspartnership.co.uk/wp-content/uploads/2018/03/Why-Community-Transport-Matters.jpg’);”><a class=”entry-featured-image-url” href=”https://taspartnership.co.uk/post-template-2/”><br /> <img src=”https://taspartnership.co.uk/wp-content/uploads/2018/03/Why-Community-Transport-Matters.jpg” alt=”TAS connects Shadow Transport Secretary with Community Transport” /><br /> </a></div><br /> </div><br /> <div class=”post-content”></p><p><a class=”abs-url” href=”https://taspartnership.co.uk/post-template-2/”>TAS connects Shadow Transport Secretary with Community Transport</a><br /> <h2 class=”entry-title”><a href=”https://taspartnership.co.uk/post-template-2/”>TAS connects Shadow Transport Secretary with Community Transport</a></h2><br /> <div class=”post-data”>The TAS Partnership organised a visit by Lilian Greenwood, Labour MP for Nottingham South and Shadow Transport Minister to Nottingham Community Transport (Nottingham CT) last Friday (May 20).</div><br /> </div><br /> <p class=”post-meta”><span class=”published”><span class=”et-pb-icon”></span>Mar 25, 2018</span></p></p><p></article><!– .et_pb_post_extra –></p><p><article id=”post-3880″ class=”et_pb_post et_pb_post_extra et_pb_text_align_left et-waypoint et_pb_animation_top el_dbe_block_extended image-top post-3880 type-post status-publish format-standard has-post-thumbnail hentry category-bus”><br /> <div class=”post-categories”><a href=”https://taspartnership.co.uk/category/bus/” rel=”category tag”>Bus</a></div><br /> <div class=”post-media-container”><br /> <div class=”post-media” style=”background-image: url(‘https://taspartnership.co.uk/wp-content/uploads/2018/03/Wheelchair-space-ruling-fine-–-but-new-driver-training-needed.jpg’);”><a class=”entry-featured-image-url” href=”https://taspartnership.co.uk/wheelchair-space-ruling-fine-but-new-driver-training-needed/”><br /> <img src=”https://taspartnership.co.uk/wp-content/uploads/2018/03/Wheelchair-space-ruling-fine-–-but-new-driver-training-needed.jpg” alt=”‘Wheelchair space ruling fine – but new driver training needed’” /><br /> </a></div><br /> </div><br /> <div class=”post-content”></p><p><a class=”abs-url” href=”https://taspartnership.co.uk/wheelchair-space-ruling-fine-but-new-driver-training-needed/”>‘Wheelchair space ruling fine – but new driver training needed’</a><br /> <h2 class=”entry-title”><a href=”https://taspartnership.co.uk/wheelchair-space-ruling-fine-but-new-driver-training-needed/”>‘Wheelchair space ruling fine – but new driver training needed’</a></h2><br /> </div><br /> <p class=”post-meta”><span class=”published”><span class=”et-pb-icon”></span>Mar 25, 2018</span></p></p><p></article><!– .et_pb_post_extra –></p><p></div><br /> </div><br /> <!– .et_pb_posts –></p>
We can help your transport operations
PAGES
<div class=”section group “><!– –><div class=”col span_1_of_3 sub-footer-left”><!– –><!– –><div class=”fa-x”><a target=”_blank” href=”https://twitter.com/taspartnership?lang=en”><!– –><span> <i class=”fab fa-linkedin-in” data-fa-transform=”shrink-6 ” data-fa-mask=”fas fa-circle” style=”background:”></i> </span></a></div><!– –><div class=”fa-x”><a target=”_blank” href=”https://twitter.com/taspartnership?lang=en”><!– –><!– –><span> <i class=”fab fa-twitter” data-fa-transform=”shrink-6 ” data-fa-mask=”fas fa-circle” style=”background:”></i> </span></a></div><!– –><div class=”fa-x”><!– –><!– –> <a target=”_blank” href=”https://taspartnership.co.uk/feed”><!– –><!– –><span><i class=”fa fa-rss” data-fa-transform=”shrink-6 ” data-fa-mask=”fas fa-circle” style=”background:”></i></span></a></div><!– –></div><!– –><div class=”col span_2_of_3 sub-footer-right”><!– –><!– –><!– –><a href=”https://taspartnership.co.uk/site-map/”>Site Map</a><!– –><a href=”https://taspartnership.co.uk/modern-slavery-act/”>Modern Slavery Statement |</a></div><!– –></div><div class=”accessibility-nav-bar”><!– –> <i style=”color:#FFB61E; text-align:center; position:relative; left:10px; margin:8px 15px 5px 0;” class=”fa fa-eye”></i><!– –> <!– –> <a id=”increase_font” href=”javascript: void(0)” class=””><i class=”fa fa-search-plus”></i></a><!– –> <!– –><!–<!– –> <a id=”High_Contrast” href=”javascript: void(0)” class=””><i class=”fa fa-adjust”></i></a><!– –> –><!– –><!– –></div><!– –><!– –><script><!– –><!– –> jQuery(document).ready(function ($) {<!– –><!– –><!– –> // /////////// SERVICE SELECTION GRID ////////////////////////<!– –><!– –> // RETURN TO SELECT BTN <!– –><!– –><!– –> // Go Back BTN<!– –><!– –> $(“.ReturnToServiceSelect”).click(function() {<!– –> $(“.ReturnToServiceSelect”).toggle(0.1);<!– –> $(“.sector-service-select”).fadeToggle(“fast”, “linear”);<!– –> $(“.bus-service-select”).hide();<!– –> $(“.rail-service-select”).hide();<!– –> $(“.private-sector-service-select”).hide();<!– –> $(“.community-transport-service-select”).hide();<!– –> $(“.local-authority-service-select”).hide();<!– –> $(“.government-department-service-select”).hide();<!– –> $(“.planning-development-service-select”).hide();<!– –> $(“.other-service-select”).hide();<!– –> $(“.operator-selector”).show();<!– –><!– –> $(“.step-2”).removeClass(“active”)<!– –> $(“.step-3”).removeClass(“active”)<!– –> });<!– –><!– –><!– –> $(“#WizardReturns”).click(function() {<!– –> $(“.ReturnToServiceSelect”).toggle(0.1);<!– –> $(“.sector-service-select”).fadeToggle(“fast”, “linear”);<!– –> $(“.bus-service-select”).hide();<!– –> $(“.rail-service-select”).hide();<!– –> $(“.private-sector-service-select”).hide();<!– –> $(“.community-transport-service-select”).hide();<!– –> $(“.local-authority-service-select”).hide();<!– –> $(“.government-department-service-select”).hide();<!– –> $(“.planning-development-service-select”).hide();<!– –> $(“.other-service-select”).hide();<!– –> $(“.operator-selector”).show();<!– –><!– –> $(“.step-2”).removeClass(“active”)<!– –> $(“.step-3”).removeClass(“active”)<!– –> });<!– –><!– –><!– –> <!– –> <!– –> <!– –> // Sub Filter JS <!– –><!– –> $(“#BusMarketResearchFilterBtn”).click(function() {<!– –> $(“.service”).hide(1);<!– –> $(“.busMarketResearch”).fadeIn();<!– –> $(“#BusMarketResearchFilterBtn”).toggleClass(“active”)<!– –> $(“.step-3”).addClass(“active”)<!– –> });<!– –><!– –> $(“#BusSchedulingFilterBtn”).click(function() {<!– –> $(“.service”).hide(1);<!– –> $(“.busScheduling”).fadeIn();<!– –> $(“#BusMarketResearchFilterBtn”).toggleClass(“active”)<!– –> $(“.step-3”).addClass(“active”)<!– –> });<!– –><!– –> $(“#BusSavingsFilterBtn”).click(function() {<!– –> $(“.service”).hide(1);<!– –> $(“.busSavings”).fadeIn();<!– –> $(“#BusMarketResearchFilterBtn”).toggleClass(“active”)<!– –> $(“.step-3”).addClass(“active”)<!– –> });<!– –><!– –> $(“#BusTicketingFilterBtn”).click(function() {<!– –> $(“.service”).hide(1);<!– –> $(“.busTicketing”).fadeIn();<!– –> $(“#BusMarketResearchFilterBtn”).toggleClass(“active”)<!– –> $(“.step-3”).addClass(“active”)<!– –> });<!– –><!– –> $(“#BusPlanningFilterBtn”).click(function() {<!– –> $(“.service”).hide(1);<!– –> $(“.busPlanning”).fadeIn();<!– –> $(“#BusMarketResearchFilterBtn”).toggleClass(“active”)<!– –> $(“.step-3”).addClass(“active”)<!– –> });<!– –><!– –> $(“#BusEnvironmentFilterBtn”).click(function() {<!– –> $(“.service”).hide(1);<!– –> $(“.busEnvironment”).fadeIn();<!– –> $(“.suggested-services-text”).fadeIn(300);<!– –> $(“#BusMarketResearchFilterBtn”).toggleClass(“active”)<!– –> $(“.step-3”).addClass(“active”)<!– –> });<!– –><!– –><!– –><!– –> $(“#BusShowAllFilterBtn”).click(function() {<!– –> $(“.service”).fadeIn();<!– –> });<!– –><!– –> <!– –> <!– –> <!– –> <!– –> // Bus<!– –><!– –> $(“#bus-operator-service”).click(function() {<!– –> //Bus Service On Click<!– –> $(“.service”).show();<!– –> $(“.sector-service-select”).toggle();<!– –> $(“.bus-service-select”).fadeToggle(500, “linear”);<!– –> $(“.ReturnToServiceSelect”).toggle();<!– –> $(“.step-2”).toggleClass(“active”)<!– –> $(“.step-1”).toggleClass(“active”)<!– –> });<!– –><!– –> // RAIL <!– –><!– –> $(“#rail-operator-service”).click(function() {<!– –> $(“.service”).show();<!– –> //Rail Service On Click<!– –> $(“.sector-service-select”).toggle();<!– –> $(“.rail-service-select”).fadeToggle(500, “linear”);<!– –> $(“.ReturnToServiceSelect”).toggle();<!– –> $(“.step-2”).toggleClass(“active”)<!– –> $(“.step-1”).toggleClass(“active”)<!– –> });<!– –><!– –> // PRIVATE SECTOR <!– –><!– –> $(“#private-operator-service”).click(function() {<!– –> //Rail Service On Click<!– –> $(“.service”).show();<!– –> $(“.sector-service-select”).toggle();<!– –> $(“.private-sector-service-select”).fadeToggle(500, “linear”);<!– –> $(“.ReturnToServiceSelect”).toggle();<!– –> $(“.step-2”).toggleClass(“active”)<!– –> $(“.step-1”).toggleClass(“active”)<!– –> });<!– –><!– –> // Community Transport SECTOR <!– –><!– –> $(“#community-operator-service”).click(function() {<!– –> //Rail Service On Click<!– –> $(“.service”).show();<!– –> $(“.sector-service-select”).toggle();<!– –> $(“.community-transport-service-select”).fadeToggle(500, “linear”);<!– –> $(“.ReturnToServiceSelect”).toggle();<!– –> $(“.step-2”).toggleClass(“active”)<!– –> $(“.step-1”).toggleClass(“active”)<!– –> });<!– –> // LOCAL AUTHORITY <!– –><!– –> $(“#local-authority-service”).click(function() {<!– –> //Rail Service On Click<!– –> $(“.sector-service-select”).toggle();<!– –> $(“.local-authority-service-select”).fadeToggle(500, “linear”);<!– –> $(“.ReturnToServiceSelect”).toggle();<!– –> $(“.step-2”).toggleClass(“active”)<!– –> $(“.step-1”).toggleClass(“active”)<!– –> });<!– –> // GOVERTNMENT DEPARTMENT SECTOR <!– –><!– –> $(“#government-department-service”).click(function() {<!– –> //Rail Service On Click<!– –> $(“.sector-service-select”).toggle();<!– –> $(“.government-department-service-select”).fadeToggle(500, “linear”);<!– –> $(“.ReturnToServiceSelect”).toggle();<!– –> $(“.step-2”).toggleClass(“active”)<!– –> $(“.step-1”).toggleClass(“active”)<!– –> });<!– –> // PLANNING DEPARTMENT SECTOR <!– –><!– –> $(“#planning-development-service”).click(function() {<!– –> //Rail Service On Click<!– –> $(“.sector-service-select”).toggle();<!– –> $(“.planning-development-service-select”).fadeToggle(500, “linear”);<!– –> $(“.ReturnToServiceSelect”).toggle();<!– –> $(“.step-2”).toggleClass(“active”)<!– –> $(“.step-1”).toggleClass(“active”)<!– –> });<!– –> // OTHER SECTOR <!– –><!– –> $(“#Other-Service”).click(function() {<!– –> //Rail Service On Click<!– –> $(“.sector-service-select”).toggle();<!– –> $(“.other-service-select”).fadeToggle(500, “linear”);<!– –> $(“.ReturnToServiceSelect”).toggle();<!– –> $(“.step-2”).toggleClass(“active”)<!– –> $(“.step-1”).toggleClass(“active”)<!– –> });<!– –><!– –><!– –> // ACCESSIBILITY NAVIGATION ////////////////////////<!– –><!– –><!– –> $(“#increase_font”).click(function () {<!– –> $(“.desktop-body”).toggleClass(“font-increase”);<!– –> });<!– –><!– –> $(“#High_Contrast”).click(function () {<!– –> $(“.desktop-body”).toggleClass(“High_Contrast”);<!– –> $(“#High_Contrast”).toggleClass(“active”);<!– –> });<!– –><!– –> // SERVICE SEARCH FILTER ////////////////////////<!– –><!– –><!– –> $(“#myInput”).keyup(function () {<!– –> if ($(this).val()) {<!– –> $(“#myUL”).show();<!– –> $(“.service-find-help.service-find-help”).show();<!– –> $(“#service-grid-main”).hide();<!– –> }<!– –> else {<!– –> $(“#myUL”).hide();<!– –> $(“.service-find-help”).hide();<!– –> $(“#service-grid-main”).show();<!– –> }<!– –> });<!– –> <!– –> <!– –> // PROFILE TABS ////////////////////////<!– –><!– –>(function($) {<!– –> $('.tab ul.tabs').addClass('active').find('> li:eq(0)').addClass('current');<!– –><!– –> $('.tab ul.tabs li a').click(function(g) {<!– –> var tab = $(this).closest('.tab'),<!– –> index = $(this).closest('li').index();<!– –><!– –> tab.find('ul.tabs > li').removeClass('current');<!– –> $(this).closest('li').addClass('current');<!– –><!– –> tab.find('.tab_content').find('div.tabs_item').not('div.tabs_item:eq(' + index + ')').slideUp();<!– –> tab.find('.tab_content').find('div.tabs_item:eq(' + index + ')').slideDown();<!– –><!– –> g.preventDefault();<!– –> });<!– –> })(jQuery);<!– –><!– –><!– –><!– –> // MEGA MENU<!– –><!– –><!– –><!– –><!– –> // SERVICE SELECTION GRID<!– –><!– –> // SERVICE SELECTION GRID<!– –><!– –><!– –><!– –> });<!– –><!– –><!– –></script><!– –>© Copyright The TAS Partnership Limited 2016 The TAS Partnership Limited, Guildhall House, 59-61 Guildhall Street, Preston, Lancashire PR1 3NU | Tel: 01772 204988 A limited company registered in England and Wales Number 2929880, at the above address. Cookies on our websites We use cookies to ensure we give you the best experience on our website. If you continue, we'll assume that you are happy to receive all cookies on our website.<a class=”sg-plug” href=”https://sg-webdesign.co.uk/” target=”_blank”>Website By <span>SG DESIGNS</span></a><!– –><!– –><!– –><!– –><!– –>


 In the next stage of development the rapid transit Glider services were introduced on 3 September 2018 on two corridors (East to West Belfast and Titanic Quarter) using new dedicated vehicles operating over a much enhanced infrastructure installed at a cost of £100 million. In its first 30 weeks of operation Glider services carried a total of 3.7 million passengers and although Metro patronage declined as a result of the replacement of two core corridors by Glider the combined operations registered growth in excess of 7% when compared to 2017/8.
 The
The  Superbus funding is for designated urban areas with population over 75,000 and in the top 75% of deprived areas, with a submission date of no later than 30 April 2020 and awarded ‘Summer/Autumn 2020’. The focus is on bus priority infrastructure and other measures, with an associated fare cap and undertaking to increase frequencies on specified routes.
 The Rural Mobility Fund is in fact funding for Demand-Responsive Transport (DRT) services. Whilst the politicians clearly see this as the great hope for solving the ‘rural transport problem’, the civil servants had enough nous to extend eligibility into suburban areas due to the way ‘rural’ is defined in the Fund eligibility. As always there is faith that the latest developments in comms technology may finally be enough to help services make the breakthrough into sustainability / affordability.
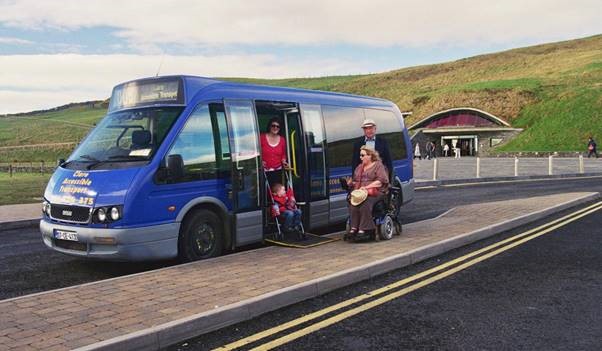 TAS is celebrating helping Galway-based Clare Bus successfully retender for services on its rural bus network.
 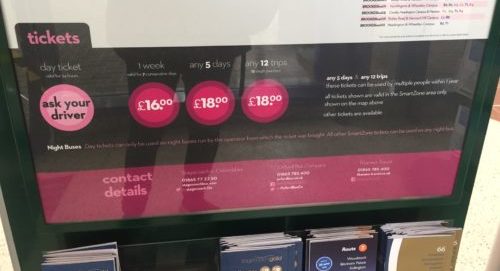 The TAS Partnership has kicked off the sixth National Fares Survey which analyses bus fares and ticketing trends and is calling for interested operators to get in touch.